
An approach to analyze windows event logs
10 Jul 2014A common task during incident response and computer forensics is to analyze logs in search of useful information. Logs come in a wide variety of formats, from well known and documented open standards to obscure and proprietary formats.
Each analyst makes use of multiple methods and tools to perform log analysis, depending on a lot of factors but often based on the format of the logs and the kind of information he/she has or is searching for.
We will try to illustrate one of the approaches we use, using one of our past projects. This project required us to investigate some alleged unauthorized access to some critical systems in a large network.
After the incident took place, the client contacted us and, after the briefing and following our protocols, we started collecting information and evidences. Most of the information came in the form of multiple log files ranging from firewalls to workstation logs.
Due to the raw amount of data, we wanted to aggregate all the information in the log files to seamlessly search through all the evidences. This way it will be easier to find suspicious activity correlating multiple sources.
Splunk Enterprise is our default tool for this kind of tasks considering its flexibility and our familiarity with it. We are also lately experimenting with the Elasticsearch ELK stack.
Near all the logs where in plain text, XML, csv or other well known or easily parseable formats. Microsoft Windows event logs being the most important exception.
For Windows event logs we routinely use excellent tools like the native Microsoft Windows Event Viewer or Log Parser. But this time we wanted to analyze large quantities of event log files and also easily correlate them with the other logs we got.
Since Microsoft Windows Vista / Server 2008, Windows event logs are stored in binary XML files, with the default ".evtx" extension (more info at Microsoft MSDN).
After some search and different approaches, we decided to use the handy python-evtx parser developed by Willi Ballenthin (@williballenthin).
The evtxdump.py tool parses the event log files and transforms the binary XML into something we thought Splunk will understand: human readable ASCII XML format.
To parse all the "evtx" files we got, we used a command like this:
find /case000/logs/evtx -iname "*.evtx" | while read file; do filename=`basename "$file"`; \
evtxdump.py "$file" > /case000/logs/parsed_evtx/"$filename".xml; done
Once we got the resulting ASCII XML files, we wanted to consolidate them with the rest of the information we gathered from our client's infrastructure and systems and that we have already indexed in Splunk.
Even though Splunk could directly extract almost all the elements and attributes from our new ASCII XML files (when specifying the KV_MODE = XML for field extraction), we detected a problem with "EventData" and "Data" elements:
<EventData><Data Name="SubjectUserSid">S-1-0-0</Data>
<Data Name="SubjectUserName">-</Data>
<Data Name="SubjectDomainName">-</Data>
<Data Name="SubjectLogonId">0x0000000000000000</Data>
<Data Name="TargetUserSid">S-1-5-18</Data>
<Data Name="TargetUserName">SYSTEM</Data>
<Data Name="TargetDomainName">NT AUTHORITY</Data>
<Data Name="TargetLogonId">0x00000000000003e7</Data>
<Data Name="LogonType">0</Data>
<Data Name="LogonProcessName">-</Data>
<Data Name="AuthenticationPackageName">-</Data>
<Data Name="WorkstationName">-</Data>
<Data Name="LogonGuid">00000000-0000-0000-0000-000000000000</Data>
<Data Name="TransmittedServices">-</Data>
<Data Name="LmPackageName">-</Data>
<Data Name="KeyLength">0</Data>
<Data Name="ProcessId">0x00000004</Data>
<Data Name="ProcessName"></Data>
<Data Name="IpAddress">-</Data>
<Data Name="IpPort">-</Data>
</EventData>
As you can see in the image below, Splunk groups all the "Data Names" in one field, for example "SubjectUserSid", "SubjectUserName" and "SubjectLogonId", and their values in another field:
![]()
To solve this problem, and properly index our Windows event logs, we had to define a Splunk's custom source type and a custom field transform.
First we defined a new source type, that we called "winevtx", in Splunk's "$SPLUNK_HOME/etc/system/local/props.conf" config file:
[winevtx]
SHOULD_LINEMERGE = true
BREAK_ONLY_BEFORE = ^\<Event xmlns=
TIME_PREFIX = SystemTime=
KV_MODE = xml
REPORT-winevtx-eventdata = winevtx_eventdata
We specified the new source type with the following options:
- SHOULD_LINEMERGE = true: because XML files are multi-line logs.
- BREAKONLYBEFORE = ^<Event xmlns=: each event begins with the "Event" element.
- TIME_PREFIX = SystemTime=: for timestamp recognition.
- KV_MODE = xml: XML field extraction mode.
- REPORT-winevtx-eventdata = winevtx_eventdata: we will use a custom field transform, to solve the "EventData" and "Data" elements problem.
Then we had to define our custom field transform "winevtxeventdata" in $SPLUNKHOME/etc/system/local/transforms.conf file:
[winevtx_eventdata]
REGEX = \<Data Name="(?<_KEY_1>[^\>]*)"\>(?<_VAL_1>[^\<]+)
At that point, it was possible for Splunk to index our XML event log files using our newly defined "winevtx" source type:
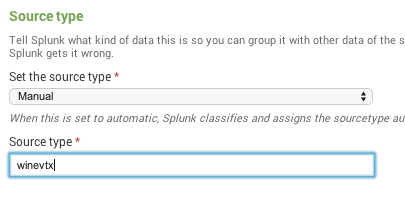
A quick test revealed that our custom transform works as expected, because Splunk correctly extracted the "EventData" and "Data" fields:
![]()
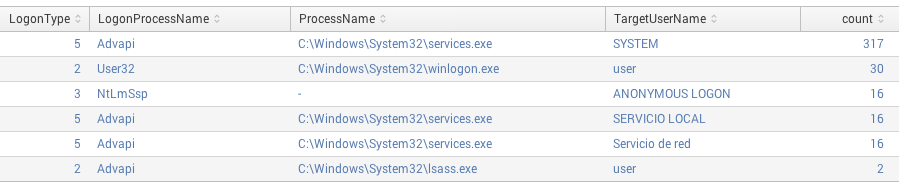
Then it was possible, for example, to search for successful logins ("System.EventID = 4624") by logon type, process name, and user name. It was a matter of typing the following search in Splunk:
"Event.System.Provider{@Name}"="Microsoft-Windows-Security-Auditing" "Event.System.EventID"=4624 | stats count by LogonType,LogonProcessName,ProcessName,TargetUserName | sort -count
Or to find how many successful logins had occurred over the time by user, with this one:
"Event.System.Provider{@Name}"="Microsoft-Windows-Security-Auditing" "Event.System.EventID"=4624 | timechart span=1d count by TargetUserName
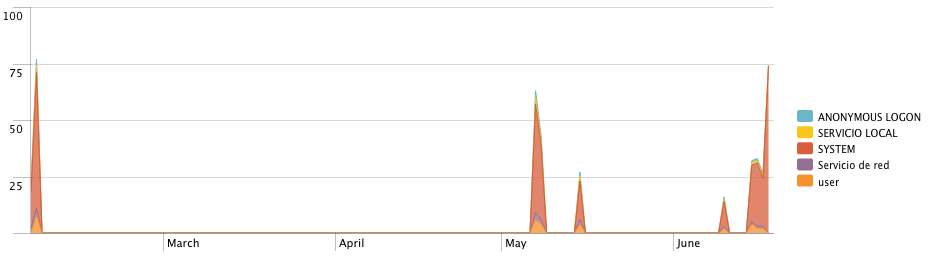
Those examples and results were made up during the writing of this post to illustrate the point. Due to the sensitivity of the past project and to not include any client's data, we used old event logs from our own test machines.
Once we finally had all the information properly indexed we analyzed it and confirmed our clients suspicions: we identified some unauthorized access to critical systems thanks to correlations from the Microsoft Event logs, the corporation firewalls, VPN concentrators and their IDS/IPS.
Furthermore we improved our log analysis capabilities for future projects.